Perceptron
Algorithm2017-05-21
import pandas as pd
import numpy as np
import matplotlib.pyplot as plt

mnist = pd.read_csv('mnist.zip')mnist.head()| label | pixel0 | pixel1 | pixel2 | pixel3 | pixel4 | pixel5 | pixel6 | pixel7 | pixel8 | ... | pixel774 | pixel775 | pixel776 | pixel777 | pixel778 | pixel779 | pixel780 | pixel781 | pixel782 | pixel783 | |
|---|---|---|---|---|---|---|---|---|---|---|---|---|---|---|---|---|---|---|---|---|---|
| 0 | 1 | 0 | 0 | 0 | 0 | 0 | 0 | 0 | 0 | 0 | ... | 0 | 0 | 0 | 0 | 0 | 0 | 0 | 0 | 0 | 0 |
| 1 | 0 | 0 | 0 | 0 | 0 | 0 | 0 | 0 | 0 | 0 | ... | 0 | 0 | 0 | 0 | 0 | 0 | 0 | 0 | 0 | 0 |
| 2 | 1 | 0 | 0 | 0 | 0 | 0 | 0 | 0 | 0 | 0 | ... | 0 | 0 | 0 | 0 | 0 | 0 | 0 | 0 | 0 | 0 |
| 3 | 4 | 0 | 0 | 0 | 0 | 0 | 0 | 0 | 0 | 0 | ... | 0 | 0 | 0 | 0 | 0 | 0 | 0 | 0 | 0 | 0 |
| 4 | 0 | 0 | 0 | 0 | 0 | 0 | 0 | 0 | 0 | 0 | ... | 0 | 0 | 0 | 0 | 0 | 0 | 0 | 0 | 0 | 0 |
5 rows × 785 columns
mnist.shape(42000, 785)Resampling
Split the data into train and test, and investigate the distribution of digits on each partition.
y = mnist['label'].values
X = mnist[[c for c in mnist.columns if c != 'label']].values
idx = np.arange(len(y))
np.random.shuffle(idx)
train_idx = idx[:10000]
test_idx = idx[10000:15000]
X_train = X[train_idx]
y_train = y[train_idx]
X_test = X[test_idx]
y_test = y[test_idx]fig, axs = plt.subplots(2, figsize=(10, 8))
pd.DataFrame({'digit': y_train}).groupby('digit').size().plot.barh(ax=axs[0])
pd.DataFrame({'digit': y_test}).groupby('digit').size().plot.barh(ax=axs[1])
axs[0].set_title('Train')
axs[1].set_title('Test')
plt.show()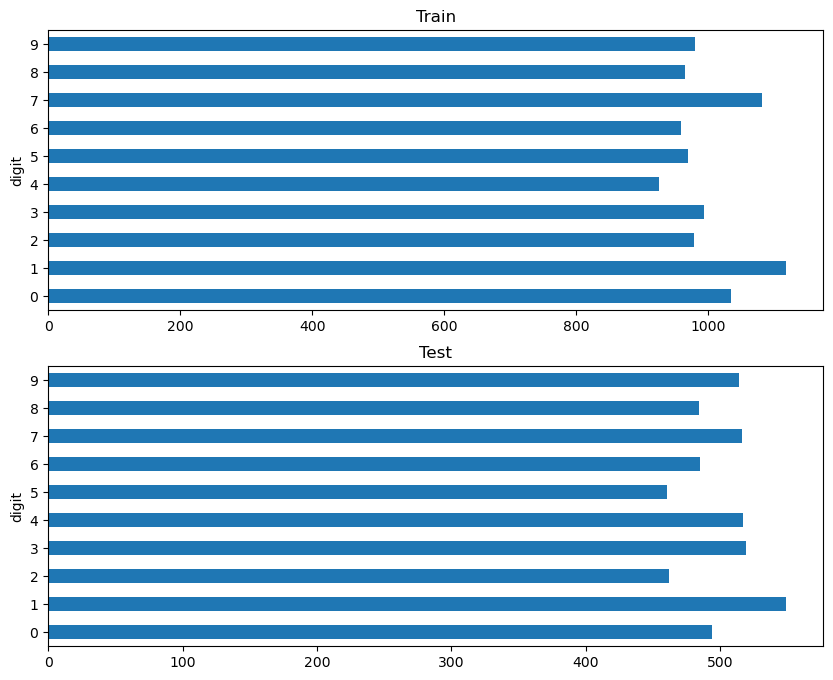
Plot a sample of the images.
fig, axs = plt.subplots(2, 5, figsize=(15, 5))
axs = axs.flatten()
for i in range(10):
    mask = (y_train == i)
    axs[i].imshow(X_train[mask][0].reshape(28, 28), cmap='gray_r')
plt.suptitle("A Sample of images")
plt.show()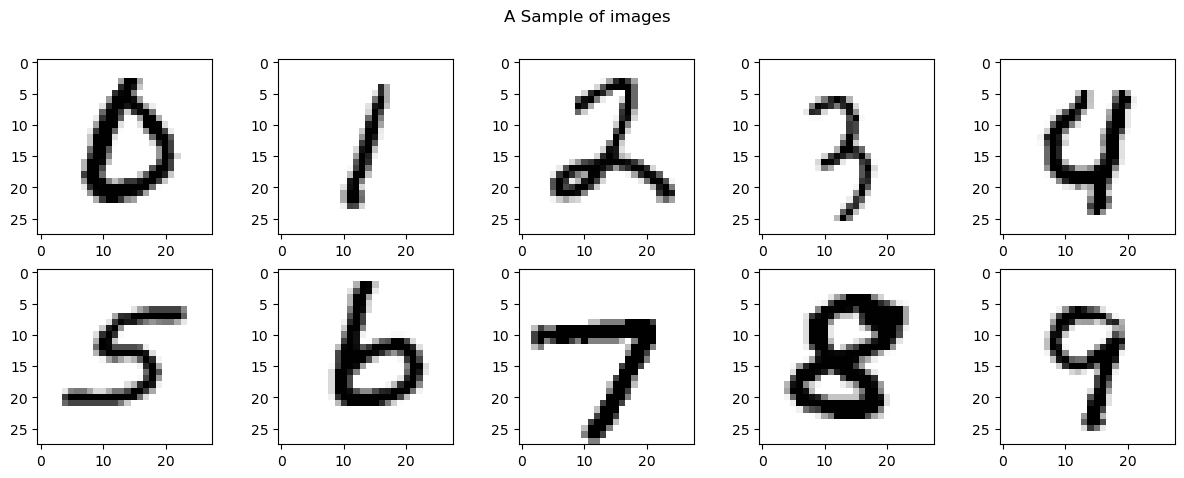
Baseline: Logistic Regression
As a baseline we will use the logistic regression model from
scikit-learn.
from sklearn.linear_model import LogisticRegressionlr = LogisticRegression(max_iter=30)
lr.fit(X_train, y_train)/Users/troelslaegsgaard/Git/laegsgaardTroels/laegsgaardTroels.github.io/src/posts/2023-09-30-reinforcement-learning-cartpole-v0/envs/reinforcement-learning/lib/python3.11/site-packages/sklearn/linear_model/_logistic.py:469: ConvergenceWarning: lbfgs failed to converge (status=1):
STOP: TOTAL NO. of ITERATIONS REACHED LIMIT.
Increase the number of iterations (max_iter) or scale the data as shown in:
https://scikit-learn.org/stable/modules/preprocessing.html
Please also refer to the documentation for alternative solver options:
https://scikit-learn.org/stable/modules/linear_model.html#logistic-regression
n_iter_i = _check_optimize_result(
LogisticRegression(max_iter=30)In a Jupyter environment, please rerun this cell to show the HTML representation or trust the notebook.
On GitHub, the HTML representation is unable to render, please try loading this page with nbviewer.org.
LogisticRegression(max_iter=30)
y_hat_train = lr.predict(X_train)
y_hat_test = lr.predict(X_test)

print("Train Accuracy", np.mean(y_hat_train == y_train))
print("Test Accuracy", np.mean(y_hat_test == y_test))
Train Accuracy 0.9374
Test Accuracy 0.9008
Multiclass Perceptron
Multiclass perceptron without intercept.
import numpy as np

class Perceptron:

    def fit(self, X, y):
        self.n_classes = len(np.unique(y))
        self.W = np.zeros(shape=(X.shape[1], self.n_classes))
        for x, y_ in zip(X, y):
            y_hat = self.predict(x)
            if y_hat != y_:
                self.W[:, y_] += x
                self.W[:, y_hat[0]] -= x

    def predict(self, X):
        if X.ndim == 1:
            X = X.reshape(1, -1)
        weights = X.dot(self.W)
        return np.argmax(weights, axis=1)
pt = Perceptron()
pt.fit(X_train, y_train)y_hat_train = pt.predict(X_train)
y_hat_test = pt.predict(X_test)print("Train Accuracy", np.mean(y_hat_train == y_train))
print("Test Accuracy", np.mean(y_hat_test == y_test))Train Accuracy 0.8766
Test Accuracy 0.859
Comments
Feel free to comment here below. A Github account is required.